The Discount-Dependency Trap: When Your #1 Line Is Only #1 Before Margin
The discount-dependency trap: when your #1 line is only #1 before margin
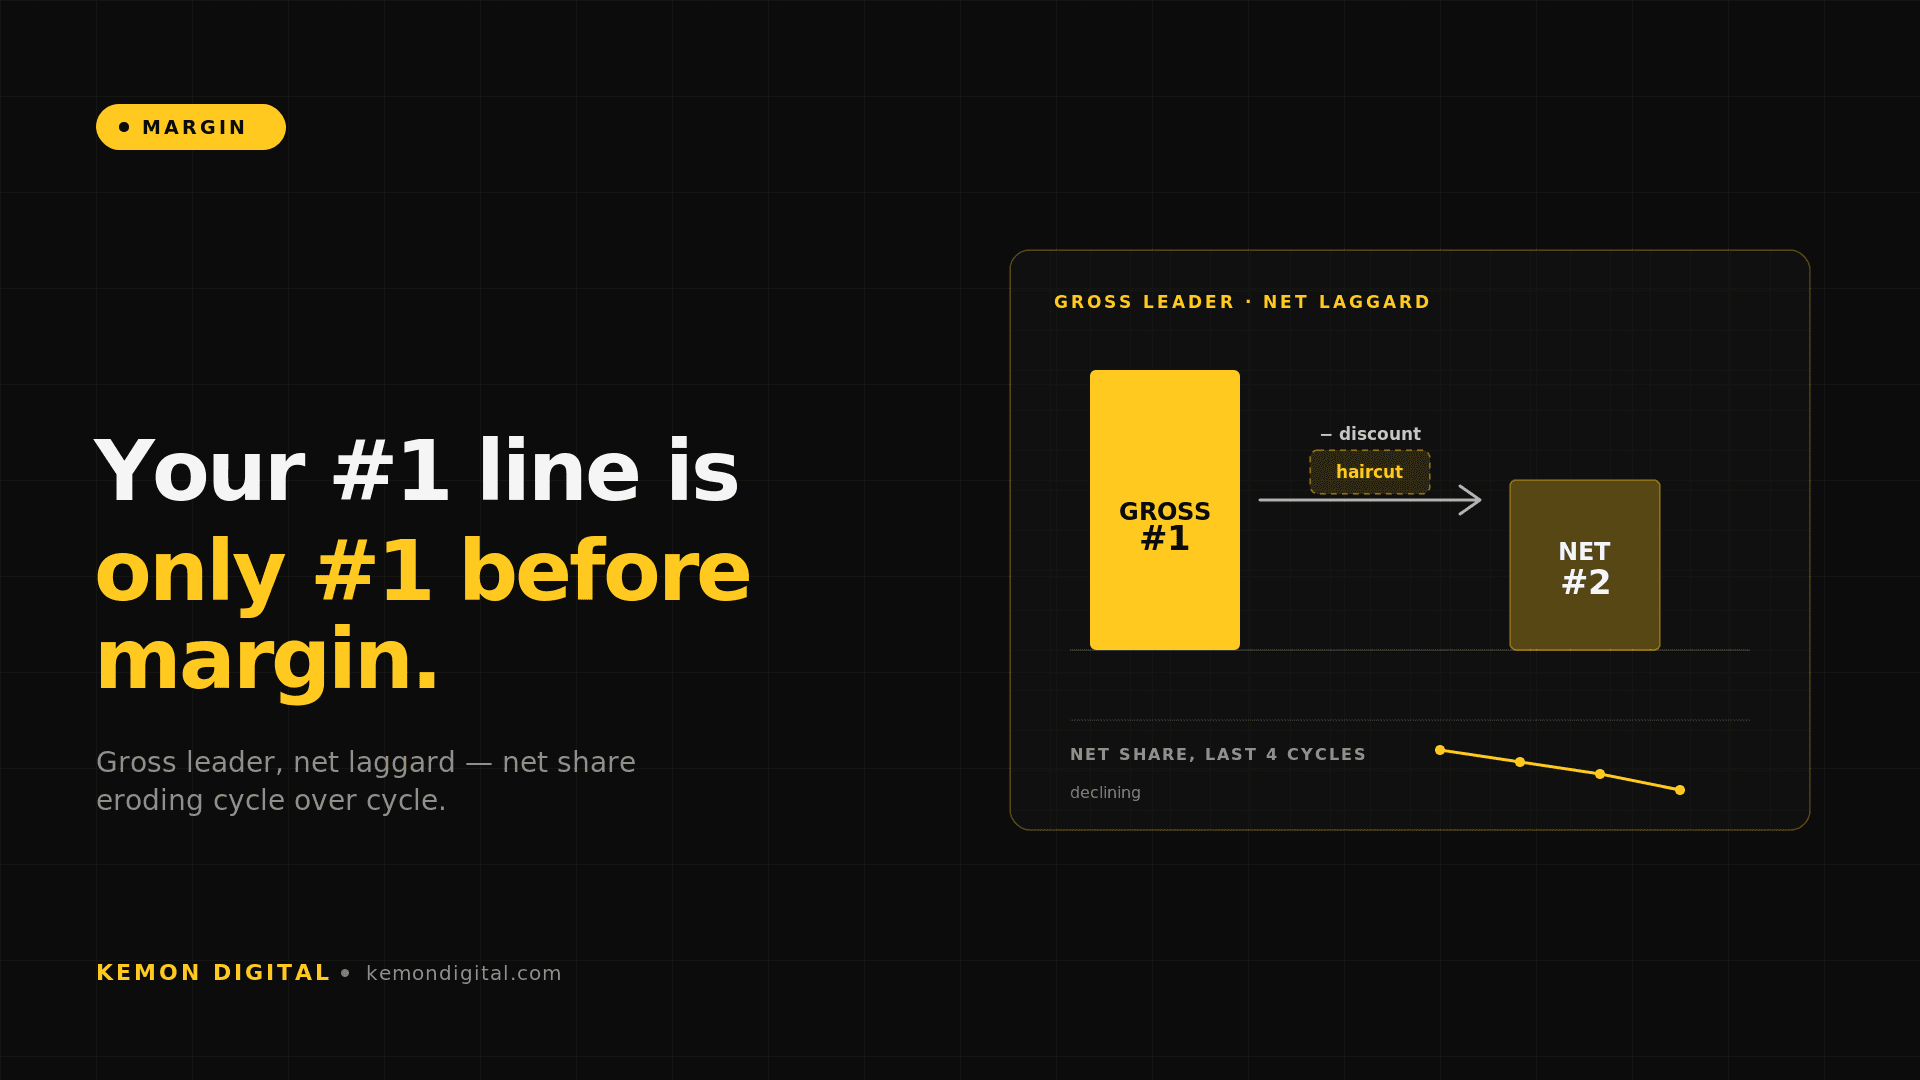
The discount-dependency trap is the most expensive brand in a portfolio, because it's the one nobody questions. One label looked like the hero of the whole portfolio — gross #1 by revenue, top of every chart. Then we took the discount haircut out, and it dropped to second on net. It wasn't a winner. It was a volume engine running on markdown, and its share of real revenue had been shrinking for four cycles straight.
A brand that ranks #1 on gross revenue can rank #2 — or lower — on net, once the discount it leans on is stripped out. The two rankings are different businesses.
Why the gross chart lies
This is a multi-brand luxury retailer running seven-figure monthly GMV across several markets, with a portfolio of distinct labels under one storefront. One of those labels had become the reflexive answer to "what's our best-selling brand?" It topped the gross revenue chart cycle after cycle, and that position earned it the lion's share of attention — merchandising real estate, ad budget, the assumption that it was the engine carrying the business.
The problem with a gross-revenue chart is that it counts the sticker, not the keep. A brand can sit at the top of it while handing most of its apparent lead back at the till in markdown. When a single number gets treated as the verdict, the discounting that produced it stays invisible — and the strategy quietly organizes itself around a line that isn't actually leading on the metric that pays the bills.
What re-ranking on net revealed
We did one thing the gross chart never does: we stripped the discount haircut out and re-ranked the portfolio on net revenue — what each brand actually keeps after markdown.
The apparent hero moved. On gross it was clearly #1. On net it fell to #2, overtaken by a brand that discounted far less and therefore kept more of every sale. The lead was real on the sticker and partly illusory on the margin.
Then we looked at the trend, because a single cycle can mislead either way. The label's share of net revenue had eroded across four consecutive cycles — sliding from roughly a quarter of the net mix toward something closer to a tenth. Not a wobble. A sustained, multi-cycle decline in the share of real revenue the brand contributed, masked entirely by a gross position that still looked dominant.
Two facts together drew the picture. First, the gross-to-net gap told us the brand's standing depended on discount — pull the markdown and the ranking changed. Second, the four-cycle erosion told us the dependency was deepening, not stabilizing. This wasn't a winner having an off quarter. It was a volume engine, running on markdown, gradually ceding ground on net to brands that didn't need the discount to sell.
The fix: manage it as a bridge, not a hero
The instinct with a declining line is to either prop it up or cut it. We did neither reflexively, because a discount-dependent volume engine isn't automatically a problem — it's a problem only if it's accidental. Run deliberately, it's a perfectly healthy de-risking bridge: it holds revenue and absorbs demand while a higher-margin, non-capped greenfield brand scales up to take its place. The danger isn't the discount. It's letting the discount-led line set the strategy without anyone deciding it should.
So we built the discipline to manage it as a bridge:
- Separate gross-leader from net-leader in every report. The gross #1 and the net #1 are now two distinct lines, side by side, every cycle. Nobody can call a brand "our best seller" again without specifying on which metric — and the net line drives allocation.
- Track discount dependency as a trend, not a snapshot. The gross-to-net gap and the brand's share of net revenue are watched cycle over cycle. A widening gap or an eroding net share is a flag, surfaced early — not discovered after four cycles of drift.
- Pace the wind-down to the rise of the replacement. The discount-led line is allowed to recede only as fast as the higher-margin greenfield brand scales to fill the gap. The bridge comes down in step with the new structure going up — never before, never by accident.
The payoff isn't a single recovered figure — it's that a brand everyone treated as the portfolio's engine turned out to be a margin-thin volume line on a four-cycle decline, and reading it on net instead of gross surfaced that in time to manage it deliberately. The brand didn't get cut and didn't get propped. It got understood — and paced.
FAQ
Q: How can a brand be #1 on gross revenue but not the real leader? A: Gross revenue counts the sticker price, not what the brand keeps after markdown. A line that discounts heavily can top the gross chart while handing most of its apparent lead back at the till. Re-rank the portfolio on net — what each brand actually keeps — and the gross #1 can fall to #2 behind a brand that discounted far less. The gross chart measures volume; the net chart measures the business that pays the bills.
Q: Is a discount-dependent brand always a problem? A: No — only when it's accidental. Run deliberately, a discount-led volume line is a healthy de-risking bridge: it holds revenue while a higher-margin brand scales to replace it. The danger is letting it define the strategy without anyone deciding it should. Keep it on purpose, watch it on net, and pace its wind-down to the replacement's rise.
Q: What signals that discount dependency is deepening rather than stable? A: Read it as a trend, not a snapshot. A single cycle's gross-to-net gap is a data point. A net-revenue share that erodes across several consecutive cycles — sliding from roughly a quarter of the mix toward a tenth — is a verdict. Watch the direction, not just the level, and flag a widening gap early.
The sticker says winning. The margin says check again.
Never let a discount-dependent line define your strategy. Re-rank on net, read dependency as a trend, and if you keep a discount-led line, keep it on purpose — as a bridge while a higher-margin brand scales to replace it. The most expensive brand in a portfolio is often the one at the top of the gross chart, because that's the one nobody questions.
Want to know which of your "best sellers" only leads before margin? Kemon runs an AI-driven portfolio audit that re-ranks every brand on net, tracks discount dependency as a trend, and flags the lines that need to be paced rather than propped. Talk to us →